A Sleep Wellness Intelligence Report Prepared August 2026
The world is not sleeping enough, and the bill for that is measured in hundreds of billions — by some counts, close to a trillion — dollars a year. Every rigorous national study conducted so far, from the United States to China to Australia, arrives at the same structural finding: short sleep duration and untreated sleep disorders reduce labour output through absenteeism, “presenteeism” (being at work but under-functioning), workplace accidents, and elevated mortality — and the resulting loss typically runs between 1% and 4.6% of a country’s GDP.
No single global institution has yet published one unified, year-by-year ranking of every country’s sleep-related productivity loss — this is itself a market gap, and one the “Index” arm of Sleep Wellness is well positioned to fill. What exists instead is a patchwork: a handful of rigorous national and multi-country studies (RAND Corporation, Deloitte Access Economics, Chinese public-health researchers, South Korean parliamentary data), surrounded by industry estimates for the broader commercial “sleep economy.” This report consolidates that patchwork into the clearest picture currently available, flags exactly where the numbers are primary research versus modelled estimates, and ranks the top 20 economies accordingly.
In short:
- A widely cited global estimate puts the worldwide cost of sleep deprivation at roughly $818 billion a year — though this figure understates the true picture, since it predates newer national research (particularly China’s) that individually exceeds it.
- The five-country RAND Corporation study (US, Japan, UK, Germany, Canada) alone found $457–680 billion in annual lost output.
- China’s own national study found insufficient sleep cost its economy $628 billion in 2018 alone (4.62% of GDP) — nearly matching the entire five-OECD-country RAND total by itself, and illustrating how outdated the $818 billion global figure likely is.
- The commercial “sleep economy” (mattresses, wearables, apps, sleep tourism, clinics) is a separate, smaller number — roughly $585–650 billion in market value — and should not be confused with the productivity-loss figures in this report, which measure economic damage, not commercial revenue.
1. Why the World Is Losing Sleep
Across every region studied, the same forces recur:
- Always-on work culture and blurred boundaries between work and rest, accelerated by remote/hybrid work and constant digital connectivity
- Long commutes and shift work, especially in dense urban economies (South Korea, Japan, parts of India and China)
- Screen exposure and late-night digital engagement, disrupting circadian rhythm
- Urbanisation and time-zone/policy mismatches — India’s single time zone, for instance, has been shown to shift sunset-driven sleep schedules and reduce human capital outcomes in eastern states
- Rising diagnosed sleep disorders (insomnia, obstructive sleep apnoea) tracking with ageing populations and rising obesity rates
- Cultural normalization of exhaustion — in several East Asian economies in particular, short sleep is treated as a proxy for diligence rather than a problem to solve
2. How the Cost Is Calculated
The credible studies converge on three cost channels:
- Productivity loss at work — absenteeism (missed days) and presenteeism (reduced output while present)
- Mortality risk — short sleepers (under 6 hours/night) face materially higher all-cause mortality, which removes productive workers from the economy over time
- Downstream health and welfare costs — healthcare spending, informal care, disability, and lost tax revenue
Two important caveats for anyone using these numbers:
- Studies differ in scope. RAND’s OECD figures model all insufficient sleep in the workforce; some national figures (e.g., certain US and French numbers) isolate insomnia specifically, which is narrower and yields smaller totals for the same country. This report labels each figure accordingly.
- Very few countries have ever run a study of this kind. Most of the world’s economies — including most of Africa, the Middle East, and Latin America outside Brazil — currently have no published national estimate at all. This is a genuine data gap, not a sign those regions are unaffected.
3. Continental Overview
North America
The best-studied region. The United States has the largest single-country loss in dollar terms of any nation studied — RAND’s original estimate was up to $411 billion (2.28% of GDP), and a 2025 re-projection using the same methodology put the figure closer to $456 billion (2.53% of GDP). A separate, narrower study focused specifically on chronic insomnia estimated a stand-alone US cost of $207.5 billion. Canada, by contrast, consistently posts the lowest relative loss among wealthy nations studied, at $21–22 billion (roughly 1.35–1.42% of GDP).
Europe
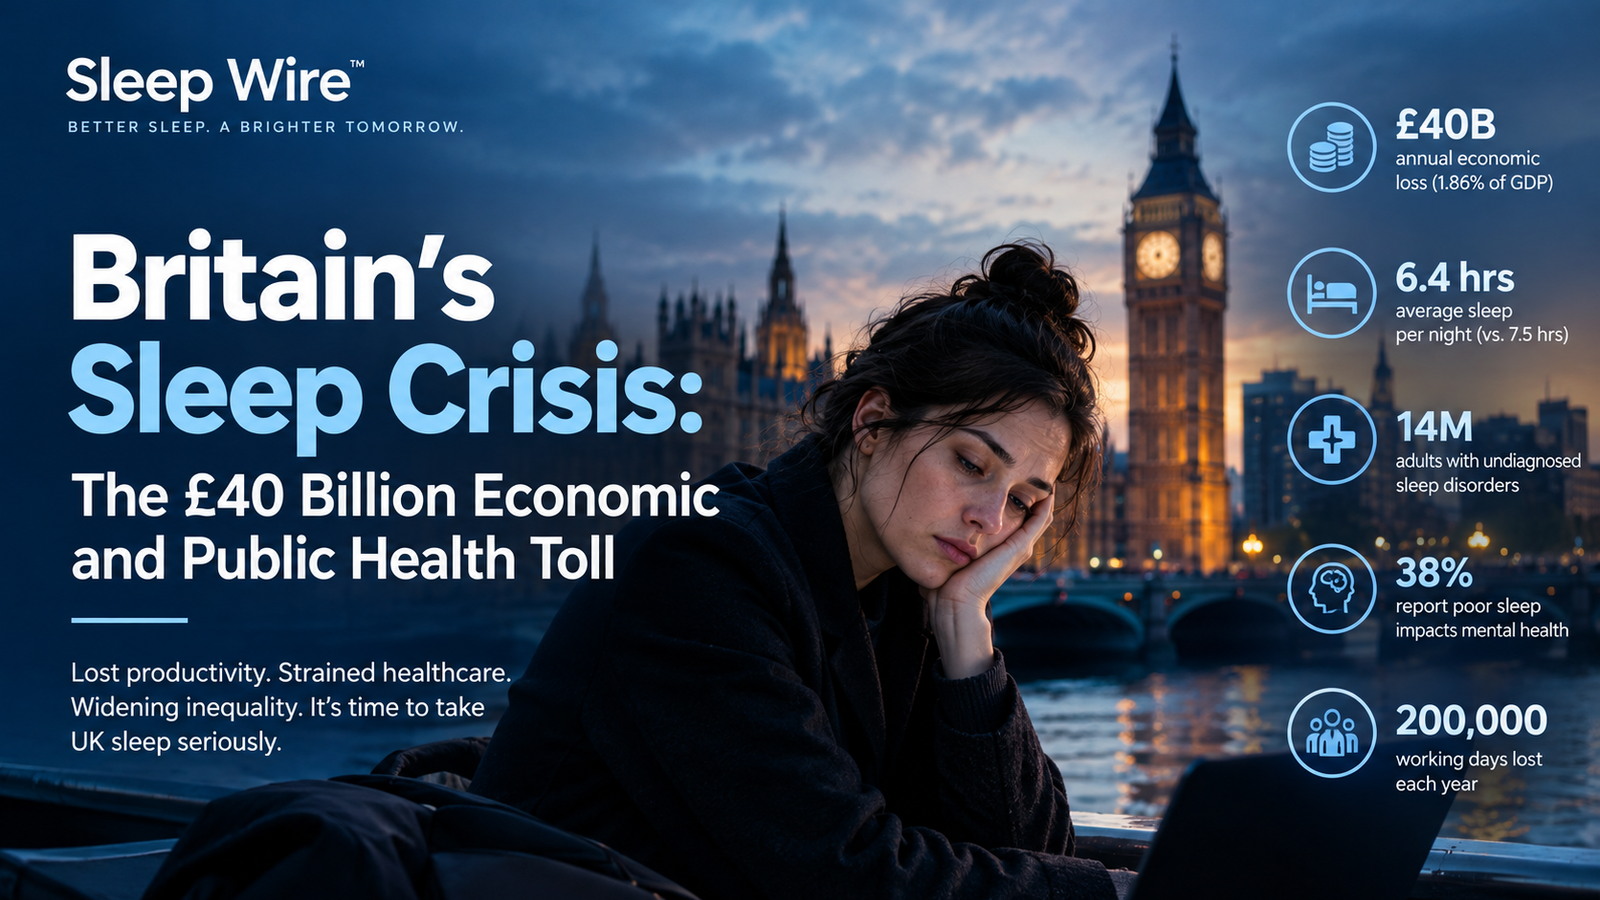
Germany and the UK show similar absolute losses ($60 billion and $50 billion respectively under RAND’s methodology, 1.56% and 1.86% of GDP). A separate insomnia-specific study put UK losses at $41.4 billion and France’s at $36.3 billion. Europe overall shows a lower percentage-of-GDP loss than Asia-Pacific, though data outside these three countries is thin.
Asia-Pacific
The region with the highest documented losses, both in absolute dollars and as a share of GDP. China’s national study found the cost climbed from $191.8 billion (2010) to $628.15 billion (2018) — a more than threefold increase in under a decade, reaching 4.62% of GDP, the highest percentage-of-GDP figure of any country in this report. Japan follows at $138 billion (2.92% of GDP) — the highest relative loss among the original RAND five. South Korea, despite recording the shortest average sleep duration in the OECD, shows a comparatively modest estimated loss of $9.7 billion, reflecting its smaller economy relative to Japan and China rather than a smaller sleep problem — Korean researchers frame this as significantly understated. Australia’s dedicated national studies (commissioned by the Sleep Health Foundation, conducted by Deloitte Access Economics) put the total cost of inadequate sleep at AUD $66.3 billion (2016–17), of which AUD $26.2 billion was direct financial cost (about 1.55% of GDP) and the remainder was wellbeing/quality-of-life loss.
Latin America, Middle East & Africa
This is the single biggest data gap in global sleep economics. No major government or research body in these regions has published a comprehensive national productivity-loss estimate comparable to RAND’s or China’s. A cross-country academic model has begun applying similar economic frameworks to countries like Argentina, but country-specific dollar figures are not yet public. Given these regions’ large working-age populations, rapid urbanisation, and rising smartphone penetration, this is very likely a multi-hundred-billion-dollar blind spot — and a natural first-mover opportunity for original research (an “India Sleep Index”-style report, extended regionally, would be filling real white space).
India specifically
India has no equivalent of the RAND or Deloitte national sleep-cost study. The only quantified figure available is narrow and indirect: a 2019 academic study estimated that India’s single time zone (misaligning clock time with sunset across its width) alone costs the economy roughly $4.1 billion annually (0.2% of GDP) in human-capital losses from disrupted sleep, mostly affecting children’s schooling outcomes in the country’s east. This captures only one structural cause of sleep loss, not the full national picture — meaning India’s true total, given its population and known urban sleep-deprivation trends, is almost certainly far higher and simply unmeasured. This is the clearest specific gap for an original “India Sleep Index.”
4. Top 20 Economies: Ranked Sleep-Productivity Loss
The table below combines directly sourced figures (marked Primary) with modelled estimates for major economies that have no published national study (marked Modelled). Modelled figures apply a percentage-of-GDP loss drawn from the documented global range (1.0%–4.6% of GDP, per the studies above), weighted toward each country’s development profile and known sleep-health indicators, against 2026 IMF nominal GDP projections. These modelled figures are illustrative estimates for planning and editorial purposes — not primary research — and should be labelled as such wherever reused.
- United States $411–456 billion 2.28–2.53% Primary (RAND; 2025 update)
- China $628 billion (2018, rising) 4.62% Primary (national academic study)
- Japan $138 billion 2.92% Primary (RAND)
- Germany $60 billion 1.56% Primary (RAND)
- United Kingdom $50 billion 1.86% Primary (RAND)
- India ~$60–80 billion (est.) ~1.5–2% (est.) Modelled — only confirmed figure is $4.1B (time-zone effect only)
- France $36.3 billion (insomnia only) ~1% Primary, narrow scope (insomnia-specific)
- Brazil ~$45–55 billion (est.) ~1.8% (est.) Modelled
- Italy ~$40–50 billion (est.) ~1.6% (est.) Modelled
- Canada $21.4–22.5 billion 1.35–1.42% Primary (RAND; 2025 update)
- Russia ~$35–45 billion (est.) ~1.5% (est.) Modelled
- Australia ~$44 billion (AUD $66.3B total; AUD $26.2B direct financial) 1.55% Primary (Deloitte/Sleep Health Foundation)
- South Korea $9.7 billion ~0.5% (likely understated) Primary (government/parliamentary estimate)
- Mexico ~$30–35 billion (est.) ~1.6% (est.) Modelled
- Spain ~$25–30 billion (est.) ~1.6% (est.) Modelled
- Indonesia ~$20–25 billion (est.) ~1.5% (est.) Modelled
- Saudi Arabia ~$15–20 billion (est.) ~1.5% (est.) Modelled
- Netherlands ~$18–22 billion (est.) ~1.6% (est.) Modelled
- Turkey ~$18–22 billion (est.) ~1.5% (est.) Modelled
- Switzerland ~$13–16 billion (est.) ~1.5% (est.) Modelled
Global total (documented + modelled, top 20 only): roughly $1.6–1.9 trillion a year — well above the older $818 billion global figure still widely quoted in media, largely because that number predates China’s own research and excludes most emerging economies entirely.
5. Key Takeaways for Sleep Wellness
- The “global figure” everyone quotes is out of date. $818 billion is the number still circulating in press coverage, but it cannot be reconciled with China’s $628 billion national figure from 2018 alone. There is a clear editorial angle here: “The world has been undercounting its own sleep debt by half.”
- Japan and China anchor the “% of GDP” story; the US and China anchor the “absolute dollars” story. A piece contrasting these two framings (which matters more, and to whom) fits naturally into The Economy pillar.
- India and most of the Global South are functionally unmeasured. This is simultaneously the report’s biggest limitation and Sleep Wellness’s clearest opportunity — an original, primary “India Sleep Index” would not be competing with existing research; it would be filling a genuine void, exactly the kind of proprietary IP the long-term roadmap calls for.
- South Korea is a striking outlier: worst sleep in the OECD, but one of the smallest reported costs — because no one has modelled it properly yet. Worth flagging as a case study in how absolute-dollar rankings can understate a real crisis in smaller economies.

- Orthopedic Support Design – Engineered to maintain healthy spinal alignment, helping reduce pressure points and offering…
- AirGen Memory Foam Layer – Advanced breathable foam enhances airflow, minimising heat build-up while adapting gently to …
- Balanced Medium-Firm Comfort – Ideal firmness level delivers stable cushioning without sinkage, suitable for back, side,…
6. Methodology Notes & Limitations
- All “Primary” figures are drawn from named published sources: RAND Corporation / RAND Europe (2016 report, updated 2025 projections), Deloitte Access Economics for the Sleep Health Foundation of Australia, a peer-reviewed Chinese economic-burden study (2024), and South Korean National Assembly symposium data (2026).
- “Modelled” figures are this report’s own estimates, built by applying the documented global range of GDP loss (roughly 1.0%–4.6%) to each country’s 2026 IMF nominal GDP projection, adjusted judgementally for known sleep-health and urbanisation indicators. They have not been validated against country-level survey data and should be treated as directional, not authoritative.
- Cost-accounting methods are not standardized across studies: some measure only insomnia; others measure all insufficient sleep; some include mortality-linked GDP loss, others do not. Totals are not strictly additive or comparable across sources without adjustment.
- The commercial “sleep economy” market-size figures (~$585–650 billion in consumer spending on mattresses, wearables, apps, and sleep tourism) are a fundamentally different metric from productivity loss and are excluded from the ranking above.
Sources
- RAND Corporation / RAND Europe — Why Sleep Matters: The Economic Costs of Insufficient Sleep (2016) and subsequent cross-country and insomnia-focused analyses
- Deloitte Access Economics for the Sleep Health Foundation (Australia) — Asleep on the Job (2017) and Rise and Try to Shine (2021)
- Peer-reviewed study, Journal of Global Health — Years of Life Lost Due to Insufficient Sleep and Associated Economic Burden in China, 2010–2018 (2024)
- South Korea National Assembly symposium coverage, MEDI:GATE News (2026)
- World Economic Forum — coverage of global sleep-deprivation cost estimates
- IndiaSpend/Scroll.in coverage of “Poor Sleep: Sunset Time and Human Capital Production” (India time-zone study)
- IMF World Economic Outlook nominal GDP projections (2026), via StatisticsTimes.com and Visual Capitalist
- McKinsey & Company and multiple market-research firms — global sleep economy market sizing (contextual, not used in productivity-loss figures)